As we step into the first quarter of 2022, it’s important to examine the international container shipping trends from last year to get a clear outline of the port situations around the world, and prepare yourself better for the coming period. Check out the detailed report based on the CAx value compiled by our media partner Container xChange.
The last year was a difficult one for the container shipping industry when ports all around the world were having to deal with several hindrances such as port congestion, delays, and equipment shortages. But it seems that the situation is now reversing. To quote Johannes Schlingmeier, Container xChange Co-founder, “Over the last two quarters, the industry has faced skyrocketing container prices. However, these increases first leveled off and have now started gradually decreasing. It seems, what we’re seeing now, is a turning point.”
Container prices at the major international ports

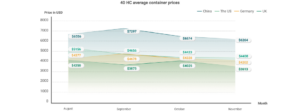
The major ports in the US, the UK, China, and Germany recorded a fall in container prices between August to November. Moreover, in the last 4 months, the container prices at the ports in the United States have fallen by almost 15%. At the Ningbo Port, a 40 HC container cost $959 less in November compared to the price in September. The sharpest fall in container prices was seen at the Port of Qingdao in the months of September to November. At Qingdao the average cost of 40 HC containers came down by 23% amounting to around $1756.
A look at the Container Availability Index at the major ports
Before getting into details about the container shipping trends, we need to give you a brief idea of Container Availability Index.

Defining Container Availability Index (CAx)
The Container Availability Index (CAx) monitors and forecasts global container equipment supply by tracking millions of monthly container moves. An index reading of below 0.5 means more containers leave a port compared to the number that enter. Container availability index above 0.5 means more containers are entering the port.
Inbound containers are piling up across several ports worldwide
Out of the 83 ports in different parts of the world (part of this research), only 9 ports have CAx values less than 0.50. Seventy four ports have CAx values greater than 0.50. Compared to 2020, 61 ports had CAx values less than 0.50. Before the pandemic, 34 ports had CAx values less than 0.50. This clearly explains the present disrupted condition of the supply chain. Usually, during the year end, we see more containers in the US, North America, and the UK and fewer containers at the Asian ports. However, only a few ports in China have low CAx values. The rest of the ports have much higher CAx values. This indicates containers all over the ports are either stuck or delayed.

The situation in the ports in China
Leasing rates fall in China
The average one-way pickup rates Ex china to UK and Germany since September fell from September till November. Moreover, these rates are expected to drop further. Average one-way pickup charges for the China -US stretch were reduced by 25% from August to September but increased from October to November.
Container prices are lowering in China
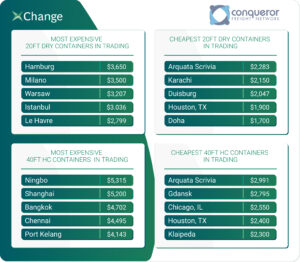
Fourteen ports in China registered decline in average prices for 40HC containers. The same trend is noticeable for 20DC containers. Average container prices (for 20DC, 40DC, and 40HC, cargo worthy) was highest in September and fell thereafter till the last week of November 2021. In Shanghai, the average prices for 40ft HC containers fell by 21% from the US $6686 in September to US $5746 as of 1st December. In Tianjin, this drop was 16%, in Yantian 12%, in Shenzhen close to 7%, in Qingdao 23%, and 11% in Dalian. Shanghai ranked third for average prices of 40HC at $5746 as of December 1st 2021 after Livorno at $6700 and Singapore at $5775. At Shenzhen, prices reduced from $7005 in September to $6573 in November.
Shanghai Port
Shanghai Port registered a massive fall in CAx values in 2020 reaching a rock bottom of 0.05. However, last year the CAx values at this port fell to 0.50. This is the ideal balance indicating the same number of containers coming and leaving the port.
Yantian Port
The CAx value of 0.27 at the Yantian port demonstrates a high number of outbound containers. However, it is not at the same level as in 2020 and 2019. In the month of November, these values were at an average of 0.05 in 2020, and 0.16 in 2019.
Tianjin Port
The CAx values at the Tianjin Port in the month of November were much higher than Ningbo and Qingdao. At week 48 of 2021, the CAx values were at 0.71, while in 2020 it was 0.16 and in 2019 it was 0.39. This suggests that there were more inbound containers at the port.
Dalian Port
Dalian port witnessed average CAx values of 0.49 in November. This figure is four times higher compared to that of 2020. However, before the pandemic, the CAx value at this port was 0.28.
A look at the port situation in India
Average container prices have somewhat stabilized in India.
Chennai Port
Chennai Port witnessed a 17% jump in average prices for 20 DC. Here, the average cost for a 40ft HC container dropped from $5550 in August to $5323 on the 1st of December. At Chennai port, the CAx values at week 48 were twice higher than that of 2020. The pre-pandemic trend at this port was decreasing CAx values, because of higher exports. However, 2021 demonstrated an opposite trend of increasing values till the end of the year.
Nhava Sheva Port
At the Port of Nhava Sheva, the Container Availability Index (CAx) values were stable at 0.78 since the end of October. While in 2019 and 2020, the values were lower showing a general declining trend till the end of the year. This suggests that more outbound containers were recorded at this port during this time of the year. In contrast, in 2021 the trend started to change. It clearly shows that exports struggled in 2021, containers were stuck at port, and inbound containers were higher. Here, the prices for 40 ft HC containers went down from $5044 in October to $4875 on the 1st of December. Before the pandemic, this price was approximately $1000 for 20DC and $2000 for 40DC, respectively.
Mundra Port
At the Mundra Port, the CAx values were five times higher compared to the values in the 48th week of 2020. Moreover, it was three times higher than the correlating week in 2019 (pre-pandemic). This trend was consistent throughout the year. This once again highlights the problem of inbound containers being stuck at the port with a possible impact on the outbound containers.
Port situation in the United States
Los Angeles
In 2021, the CAx values at this port fell from 0.85 in week 45 to 0.34 in week 48 (first week of November to last week of November).
In 2020, the CAx values dropped by 0.01 value, from 0.88 to 0.87 during the same time frame.
Long Beach Port
Here the CAx values ranged between 0.86 to 0.89 since the 31st week of 2021. In the 48th week, this value was at 0.86 and it closed the year
at similar values. Although there was a dip in these values in 2020, the forecast is not showing signs of revival this year due to the current situation of the gridlock.
Port of Savannah
The Port of Savannah witnessed consistently higher CAx values in 2021 compared to previous years. The CAx values ranged between 0.90 and 0.96. This indicates massive congestion and more loads of inbound containers.
Port of Houston
The CAx value at this port in 2020 was half of what it was in 2021. In the 48th week of 2021, the CAx at the port was 0.89. Last year, it was 0.48 and before the pandemic, it was 0.59. Undoubtedly, the port underwent an increased burden of inbound containers throughout 2021 as compared to 2020 and 2019.
Situation at the ports in Europe
The most important European ports had higher CAx values than the last two years. Moreover, the concentration of CAx values were in the CAx range of 0.63 – 0.89. This indicates more inbound containers consistently than outbound ones. As compared to 2019 and 2020 it is almost more than double the levels at the 17 busiest ports.
Port of Antwerp
Antwerp showed a five times rise in CAx values at week 48 of 2021 compared to the correlating week last year. This shows that a large number of containers were docked.
Port of Hamburg
At the Port of Hamburg, the CAx values were more than three times higher than 2020.
Port of Felixstowe
The average CAx values at the Port of Felixstowe were 0.65 in the past 3 years, but at the 48th week of 2021, the values were at 0.89.
Port of Valencia
CAx values at the port of Valencia were six times that of 2020.
Port of Sines
In 2020 the CAx value at the Port of Sines was 0.09. However, last year it increased to 0.85.
Port of Barcelona
The Port of Barcelona also registered twice the CAx values than 2020.
Summing it up
As Christian Roeloffs the Co-founder and CEO of Container xChange aptly points out, 2022 is going to be yet another year of unpredictability. We’ve also started to see container prices and leasing rates going down. Once, prices slide significantly, they risk crashing. If we look at the current demand, we see that the demand for containers hasn’t increased significantly. The current spike in rates is caused by temporary supply crunch. But with disruptions such as labor union conflicts at US ports easing up, we’ll also see the capacity challenge improving.

